Interactive Image / Image Map
Commonly, a clinician has to select which part of a patient's body has been affected. Most of the time, those locations are predefined, and searching for a proper term in a dropdown can be error-prone since many terms are very similar.
Studio supports image maps through a special representation of dropdown fields where users can select a value from predefined "hot-areas" on an image. Areas are bounded to a specific value of a field, so the resulting composition is the same as if it would be with a standard dropdown presentation of coded text.
TIP: Image map presentation is available only for coded text and its generic counterpart.
How to Show the Field as an Interactive Image?
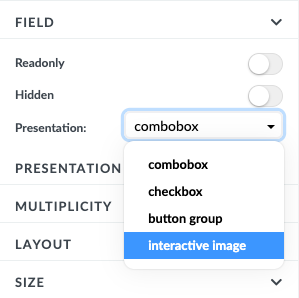
Place a coded text, ordinal or scale with predefined values (or define one yourself) to canvas and navigate to the Design panel in the property panel. Under Field section, you will see a presentation dropdown where you select Interactive image.
Once the Interactive image presentation is selected, an additional section named Interactive image properties will appear below the presentation dropdown, and the visual representation of the field will change. Since an image is not uploaded yet, you will see no image uploaded label instead of the dropdown on canvas. To upload an image, click "Upload image" button inside the Interactive image properties section and select an image from the operating system file system. If the upload is successful, you'll see the image on canvas, and "Upload image" button will change to the "Change image" button, where you can change the image if you don't like the current one.
How to Add Interactive Areas?
Under the hood, the interactive image uses a well-established concept named image map. To create an image map, we suggest using Image map generator to define areas on your image where you would like to add interactions. Carefully select all the areas and when you are done, copy the image-map code.
Don't be afraid of the term code! All you need to do with it at this point is to add it to the interactive image. To add the code, do the following:
- Click on the button "Add" that is next to the label "Image map code"
- Once the editor opens, paste the code you copied earlier in the text box
- click "Save"
Once code is pasted in Image map code input, Studio will automatically transform it to the areas on the image.
Bind interactive areas to the data model
If you followed the instructions above, you should at this point see an image with shaped areas on it in canvas, and a mapping table inside Interactive image properties section. Each row in the mapping table represents an area, and if you hover over it, it will be highlighted on the image. Each row must have a corresponding value, you must choose a value for each row from the dropdown control. If you do not choose a value, the row will not be marked as invalid row, but it will not function correctly.
The names of the areas are useful for the tooltips that appear when you move the mouse pointer over the area. You can rename area names for easier orientation by setting a new name in the provided input, or you can choose to toggle Auto-define area title from field labels to automatically bind the areas to field labels.
Choosing colors for areas
You can change the area color and border color of the areas that will appear on the image.
- Area color: changes the background color of the area when it is selected
- Borderline: changes the color of the border of the area. This color does not change whether the area is selected or not selected